KPI Insights
What are KPI Insights?
When you collect a lot of data in your organization for a long period you will need to visualise and understand your processes and analyze some metrics in your requests over time.
KPI insights make is possible to generate dashboards for your forms and processes to visualize some important metrics and summaries over time in your organization.
How to create a dashboard
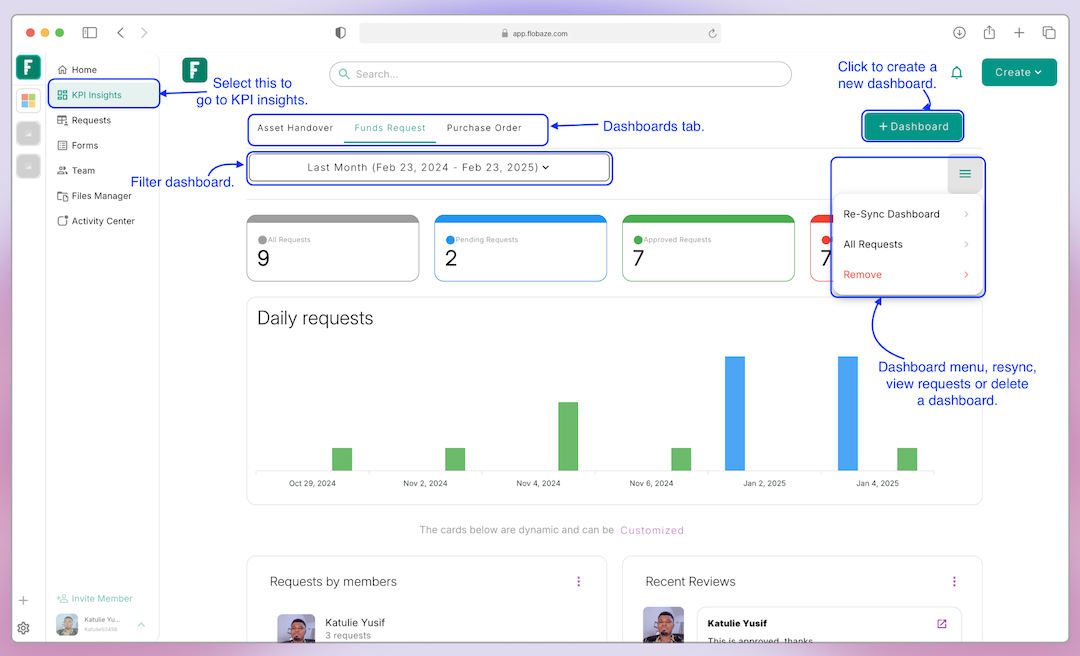
KPI insights is made up of dashboards that are linked to your forms, in this section we will look at how to create a dashboard for a form and what is generated for the dashboard. As shown in the screenshot below you can access KPI insights by selecting KPI Insights from the navigation drawer, if dashboards already exists the first one will be shown.
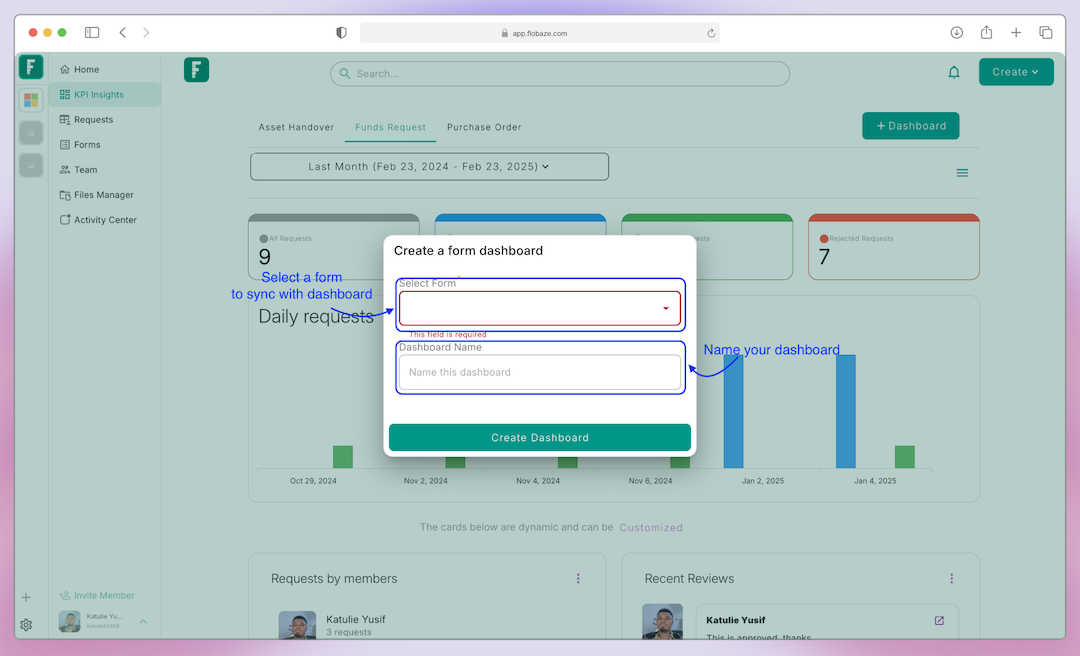
To create a new dashboard, click on the "New Dashboard" button and a dialog will appear as shown below, in the dialog select a form and enter an optional name for your dashboard and click on "Create Dashboard" to generate a dashboard as shown below
The KPI insight is made of dashboards with a lot of information some of which are static and consistent in every dashboard and some very specific to the form selected. If you have a number input in your form the dashboard will add a card for that input and show you summaries and accumulations on the that input, same way if you have a dropdown or checkbox in your form the dashboard will add aggregates and summaries about that dropdown or checkbox to your dashboard.
Customizing a dashboard
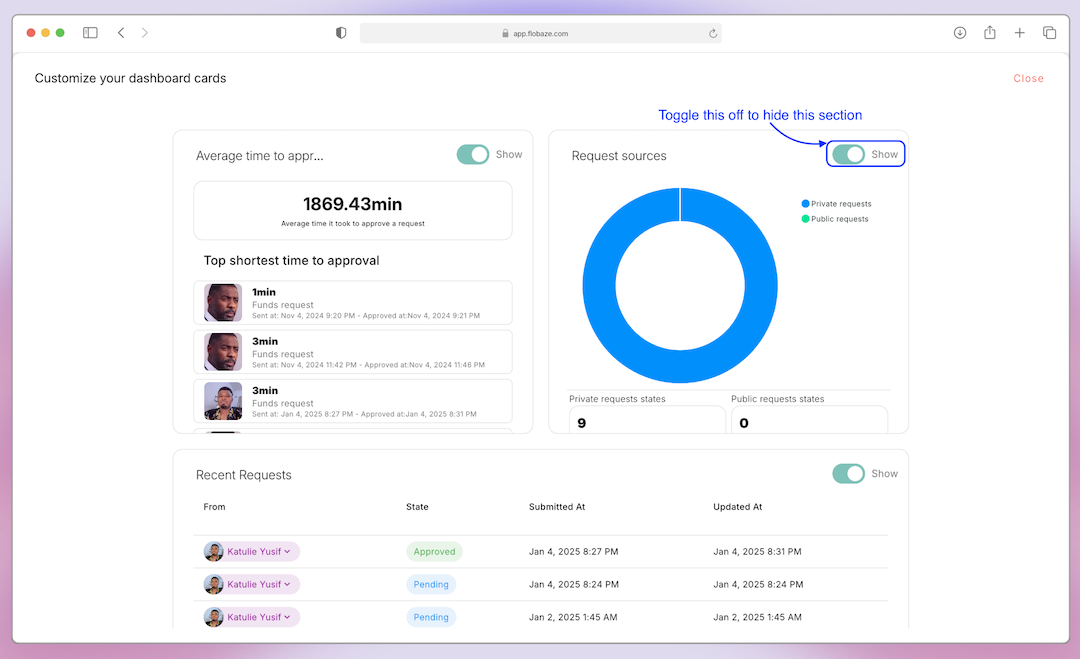
When the dashboard is generated you can hide or show some sections by clicking on the customize dashboard button and toggling them on or off as shown below
Conclusion
KPI insights is a very dynamic feature and can help understand your processes visually


